Explore key operational insights
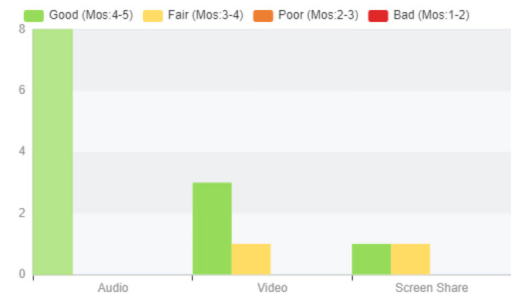
Meeting & Webinar Quality
View meeting and webinar quality (MOS Score) by meetings or participants.
Dashboard

View meeting and webinar quality (MOS Score) by meetings or participants.
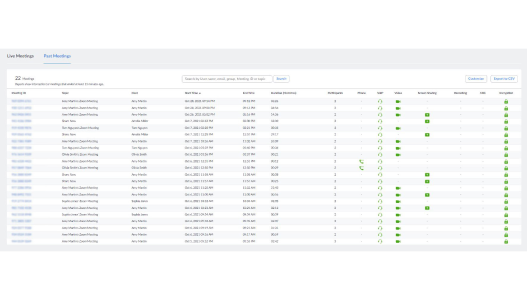
Drill down into meeting quality measurements such as audio, video, screen share quality, modalities used, and any health issues.

Select a participant in the Past Meetings list to view detailed audio, video, screen sharing, and CPU usage information.
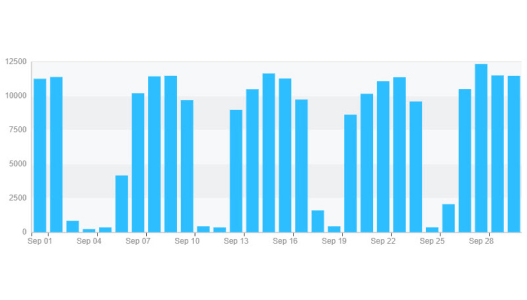
Sort usage by meetings, minutes, participants, groups, participant information, audio type, or department.

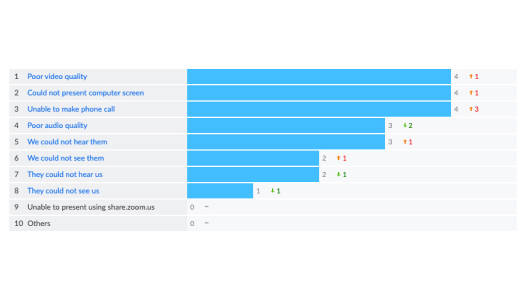
View top issues reported by meetings users and drill down to see users who reported the issue.
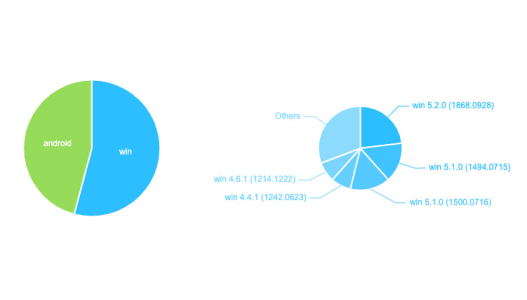
View the client versions and operating systems currently in use by your Zoom users.
Dashboard
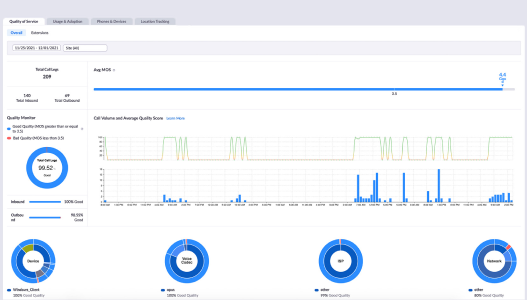
View Mean Opinion Score (MOS) by site or across all sites for both inbound and outbound calling. Drill down to see more granular call quality information.
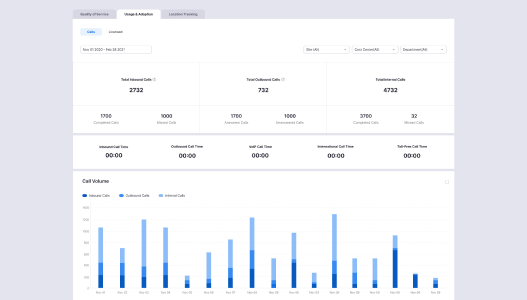
Get key usage metrics for Zoom Phone including inbound/outbound calls, completed, answered, and misse
An at-a-glance view of company and personal locations reported for emergency services.
Real-time and historical reporting are available for call queues with Zoom Phone Power Pack.
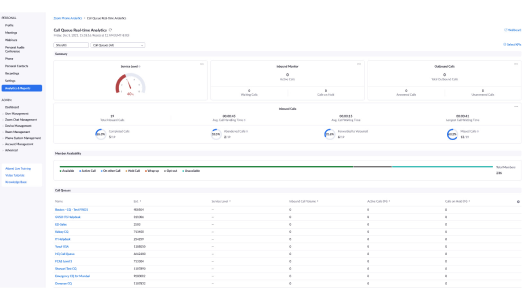
View key performance data for call queues such as SLAs, call volume, wait time, completed/abandoned/missed calls, and more.
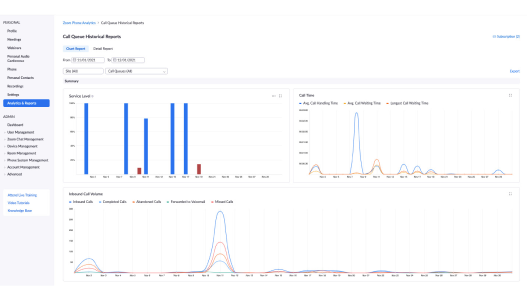
View call queue activity and trends over a selected period.
Dashboard
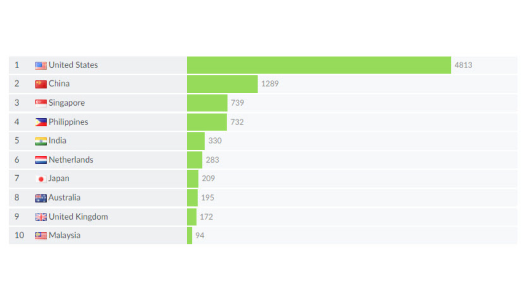
View Zoom Team Chat usage ranked by Top 10 countries.

View top users of Zoom Team Chat in your organization.

View total daily usage of Zoom Team Chat in your organization.
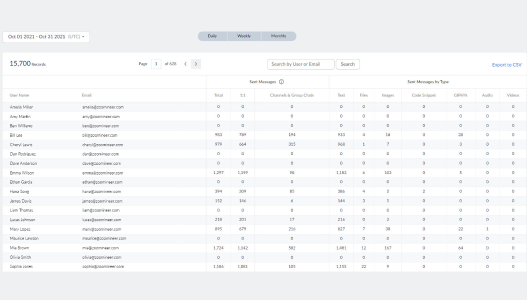
Identify what types of messaging content is being sent - text only, files, images, code snippets, GIFs, audio, and video.
Dashboard
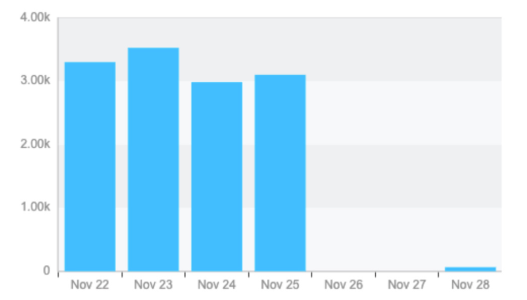
View daily activity in Zoom Rooms across your organization.
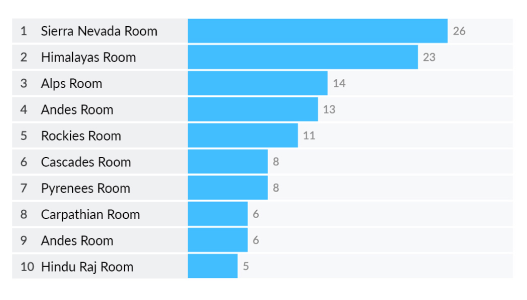
View the rooms with the most meeting minutes.

View the Zoom Rooms in your organization that are experiencing the most technical issues.
View quantified feedback from Zoom Rooms users.

View the client version in use by the Zoom Rooms in your organization.